Revenue, COGS, margins, peak hours, product performance — all in real-time.
Overview Dashboard
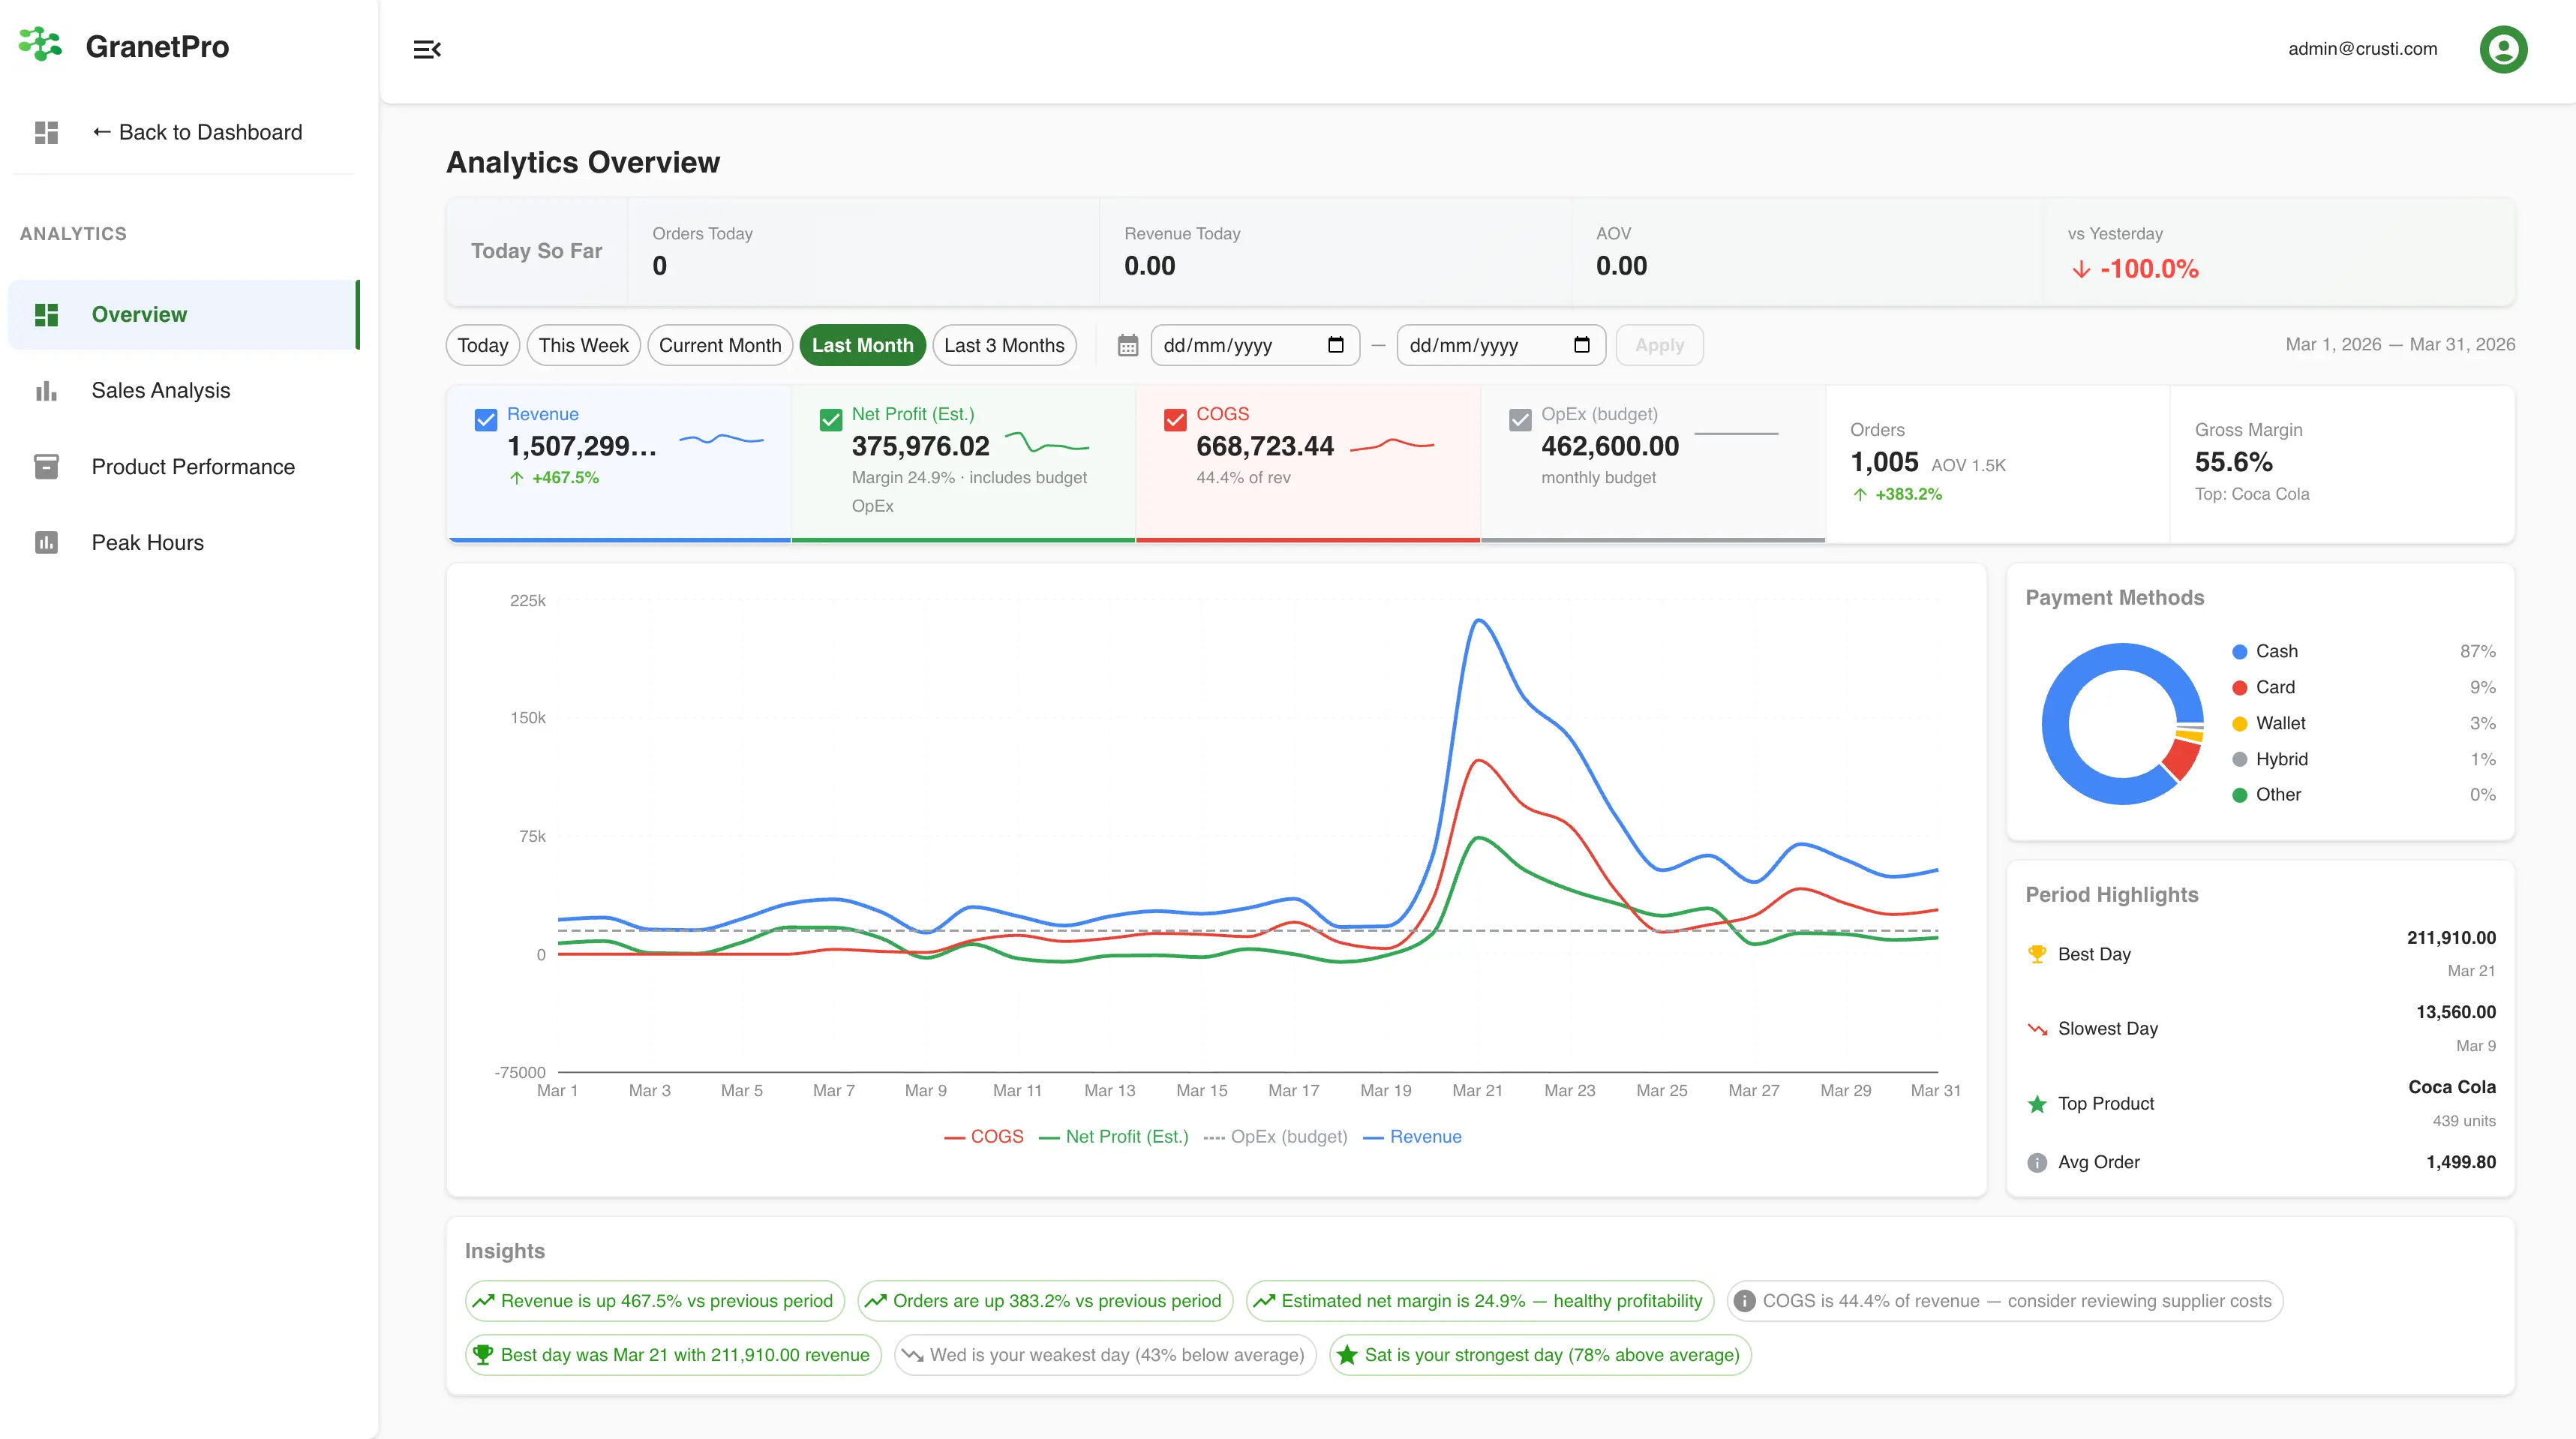
Open Granet Pro and instantly see how your business is performing — today, this week, or any custom range.
Total orders, revenue, and average order value — compared to yesterday at the same time.
Time-series chart showing revenue, cost of goods sold, operating expenses, and net profit over any period.
Mini trend lines for key metrics — spot patterns instantly without digging into detailed reports.
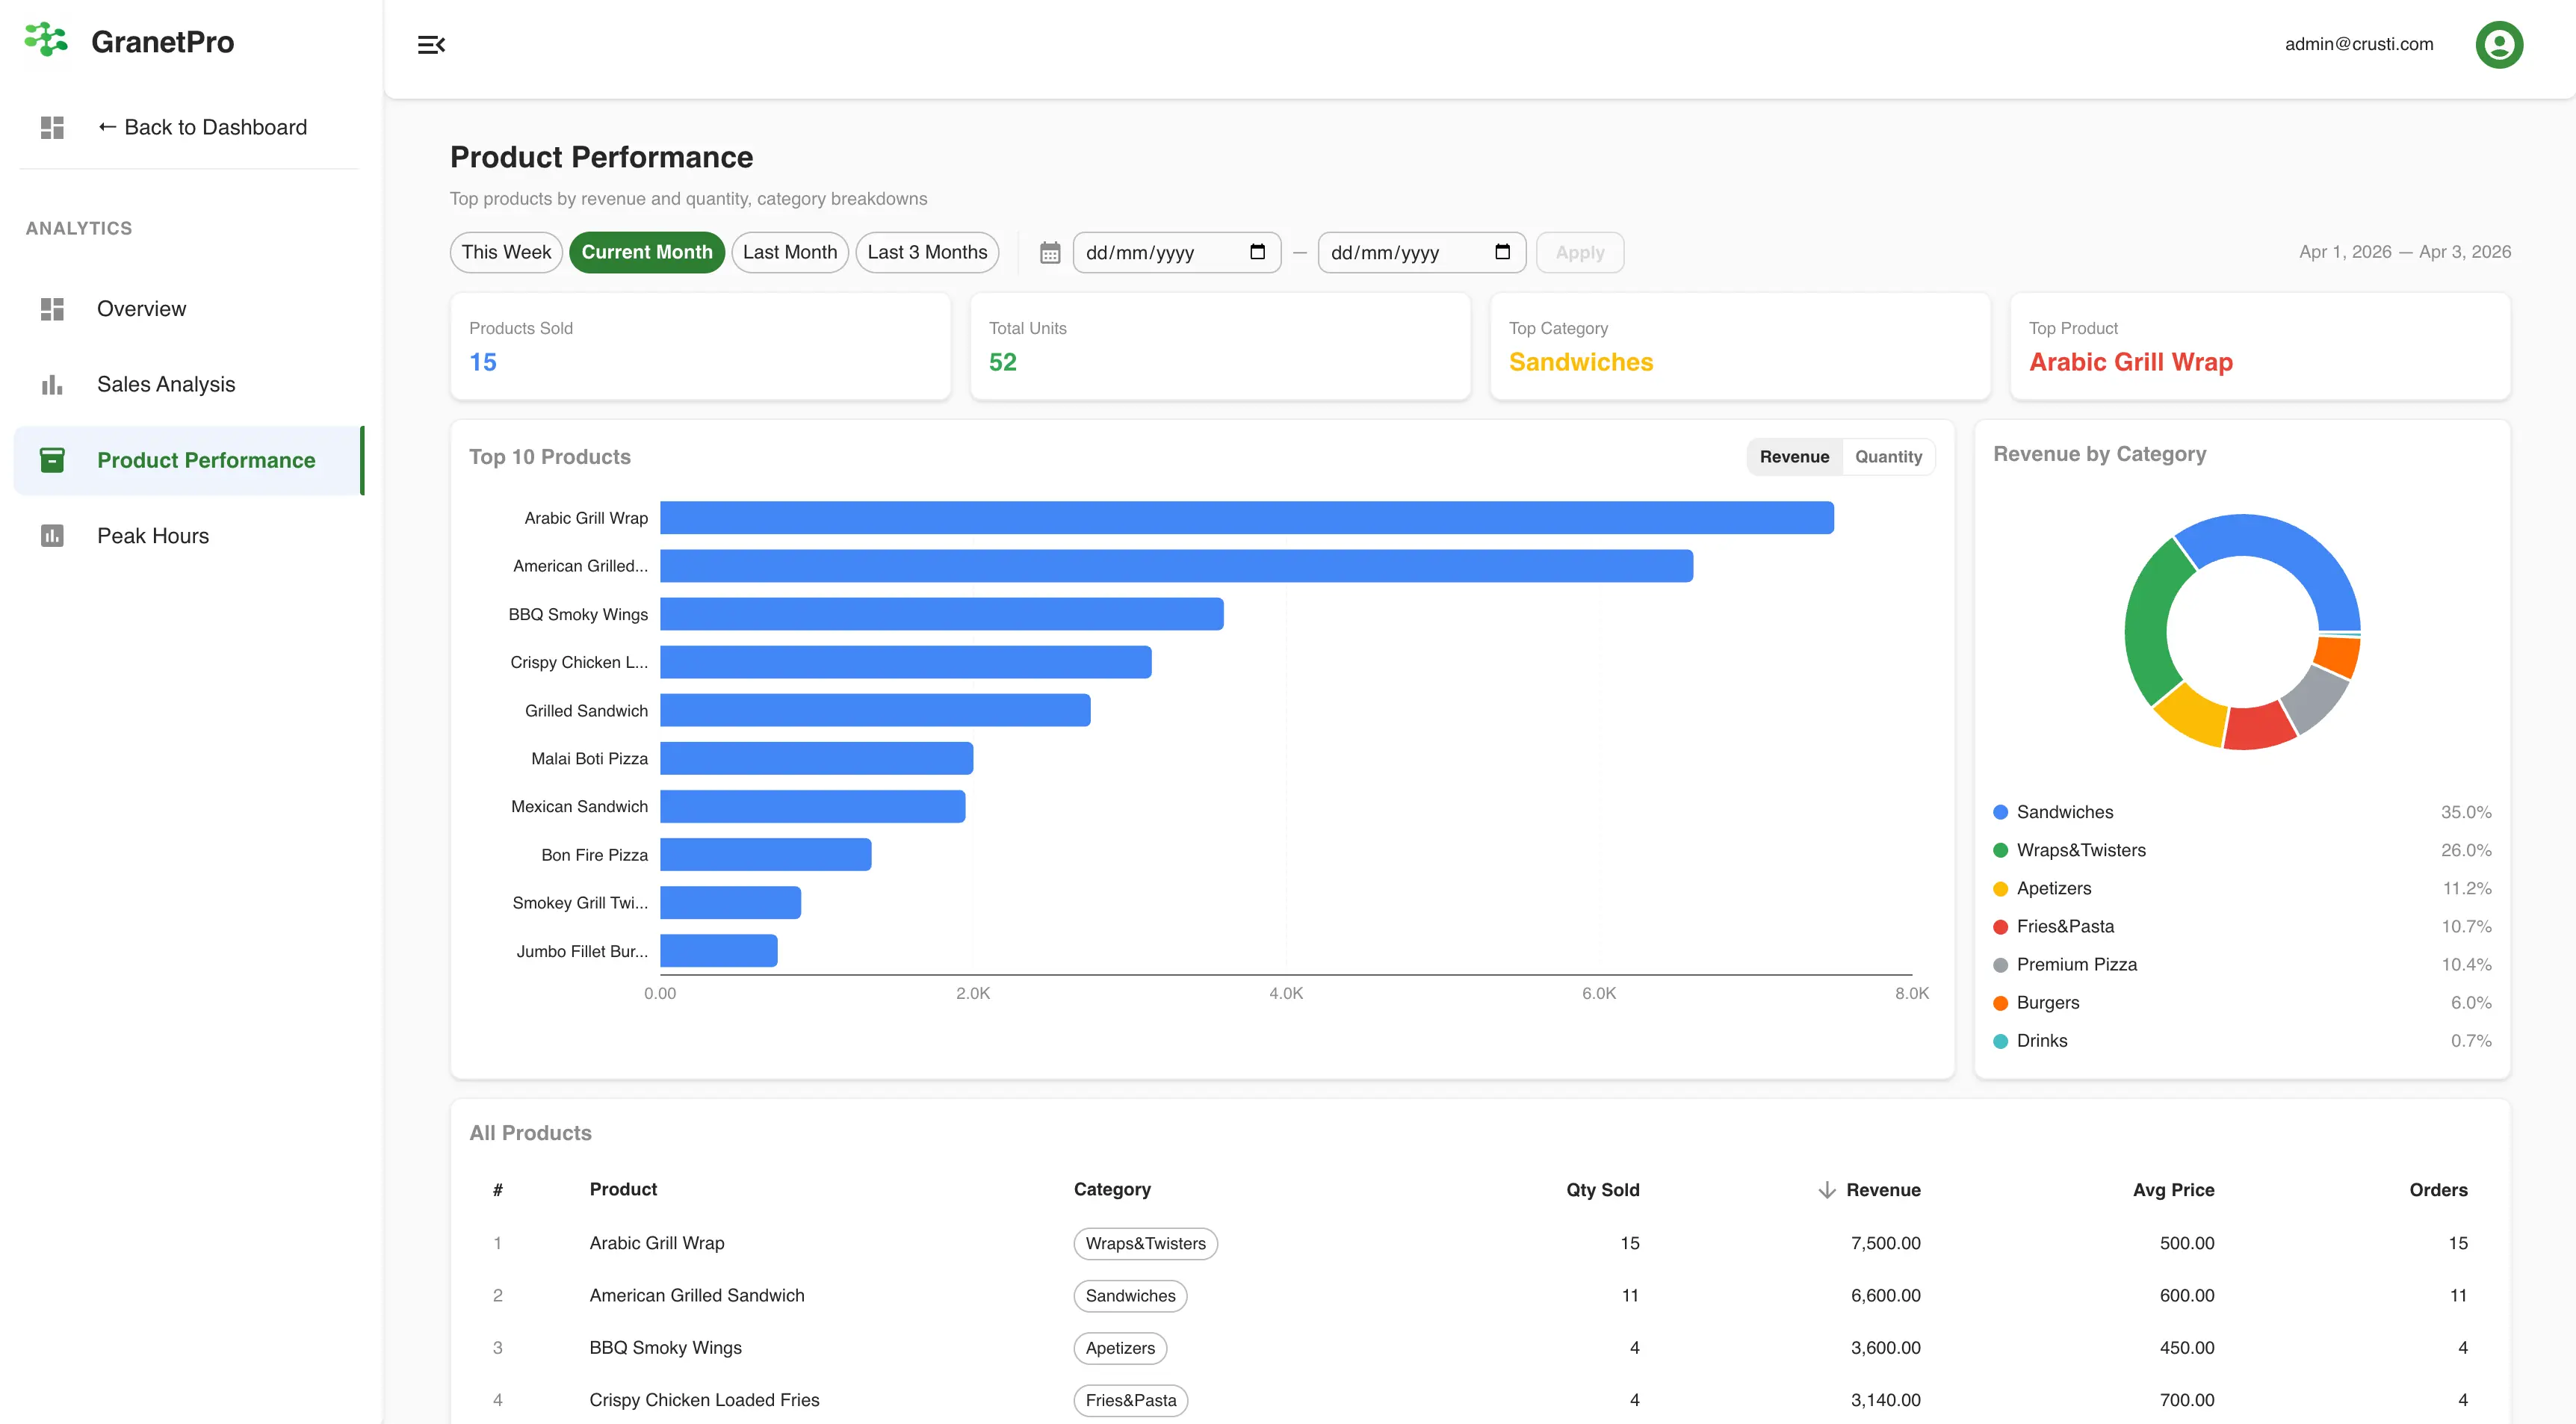
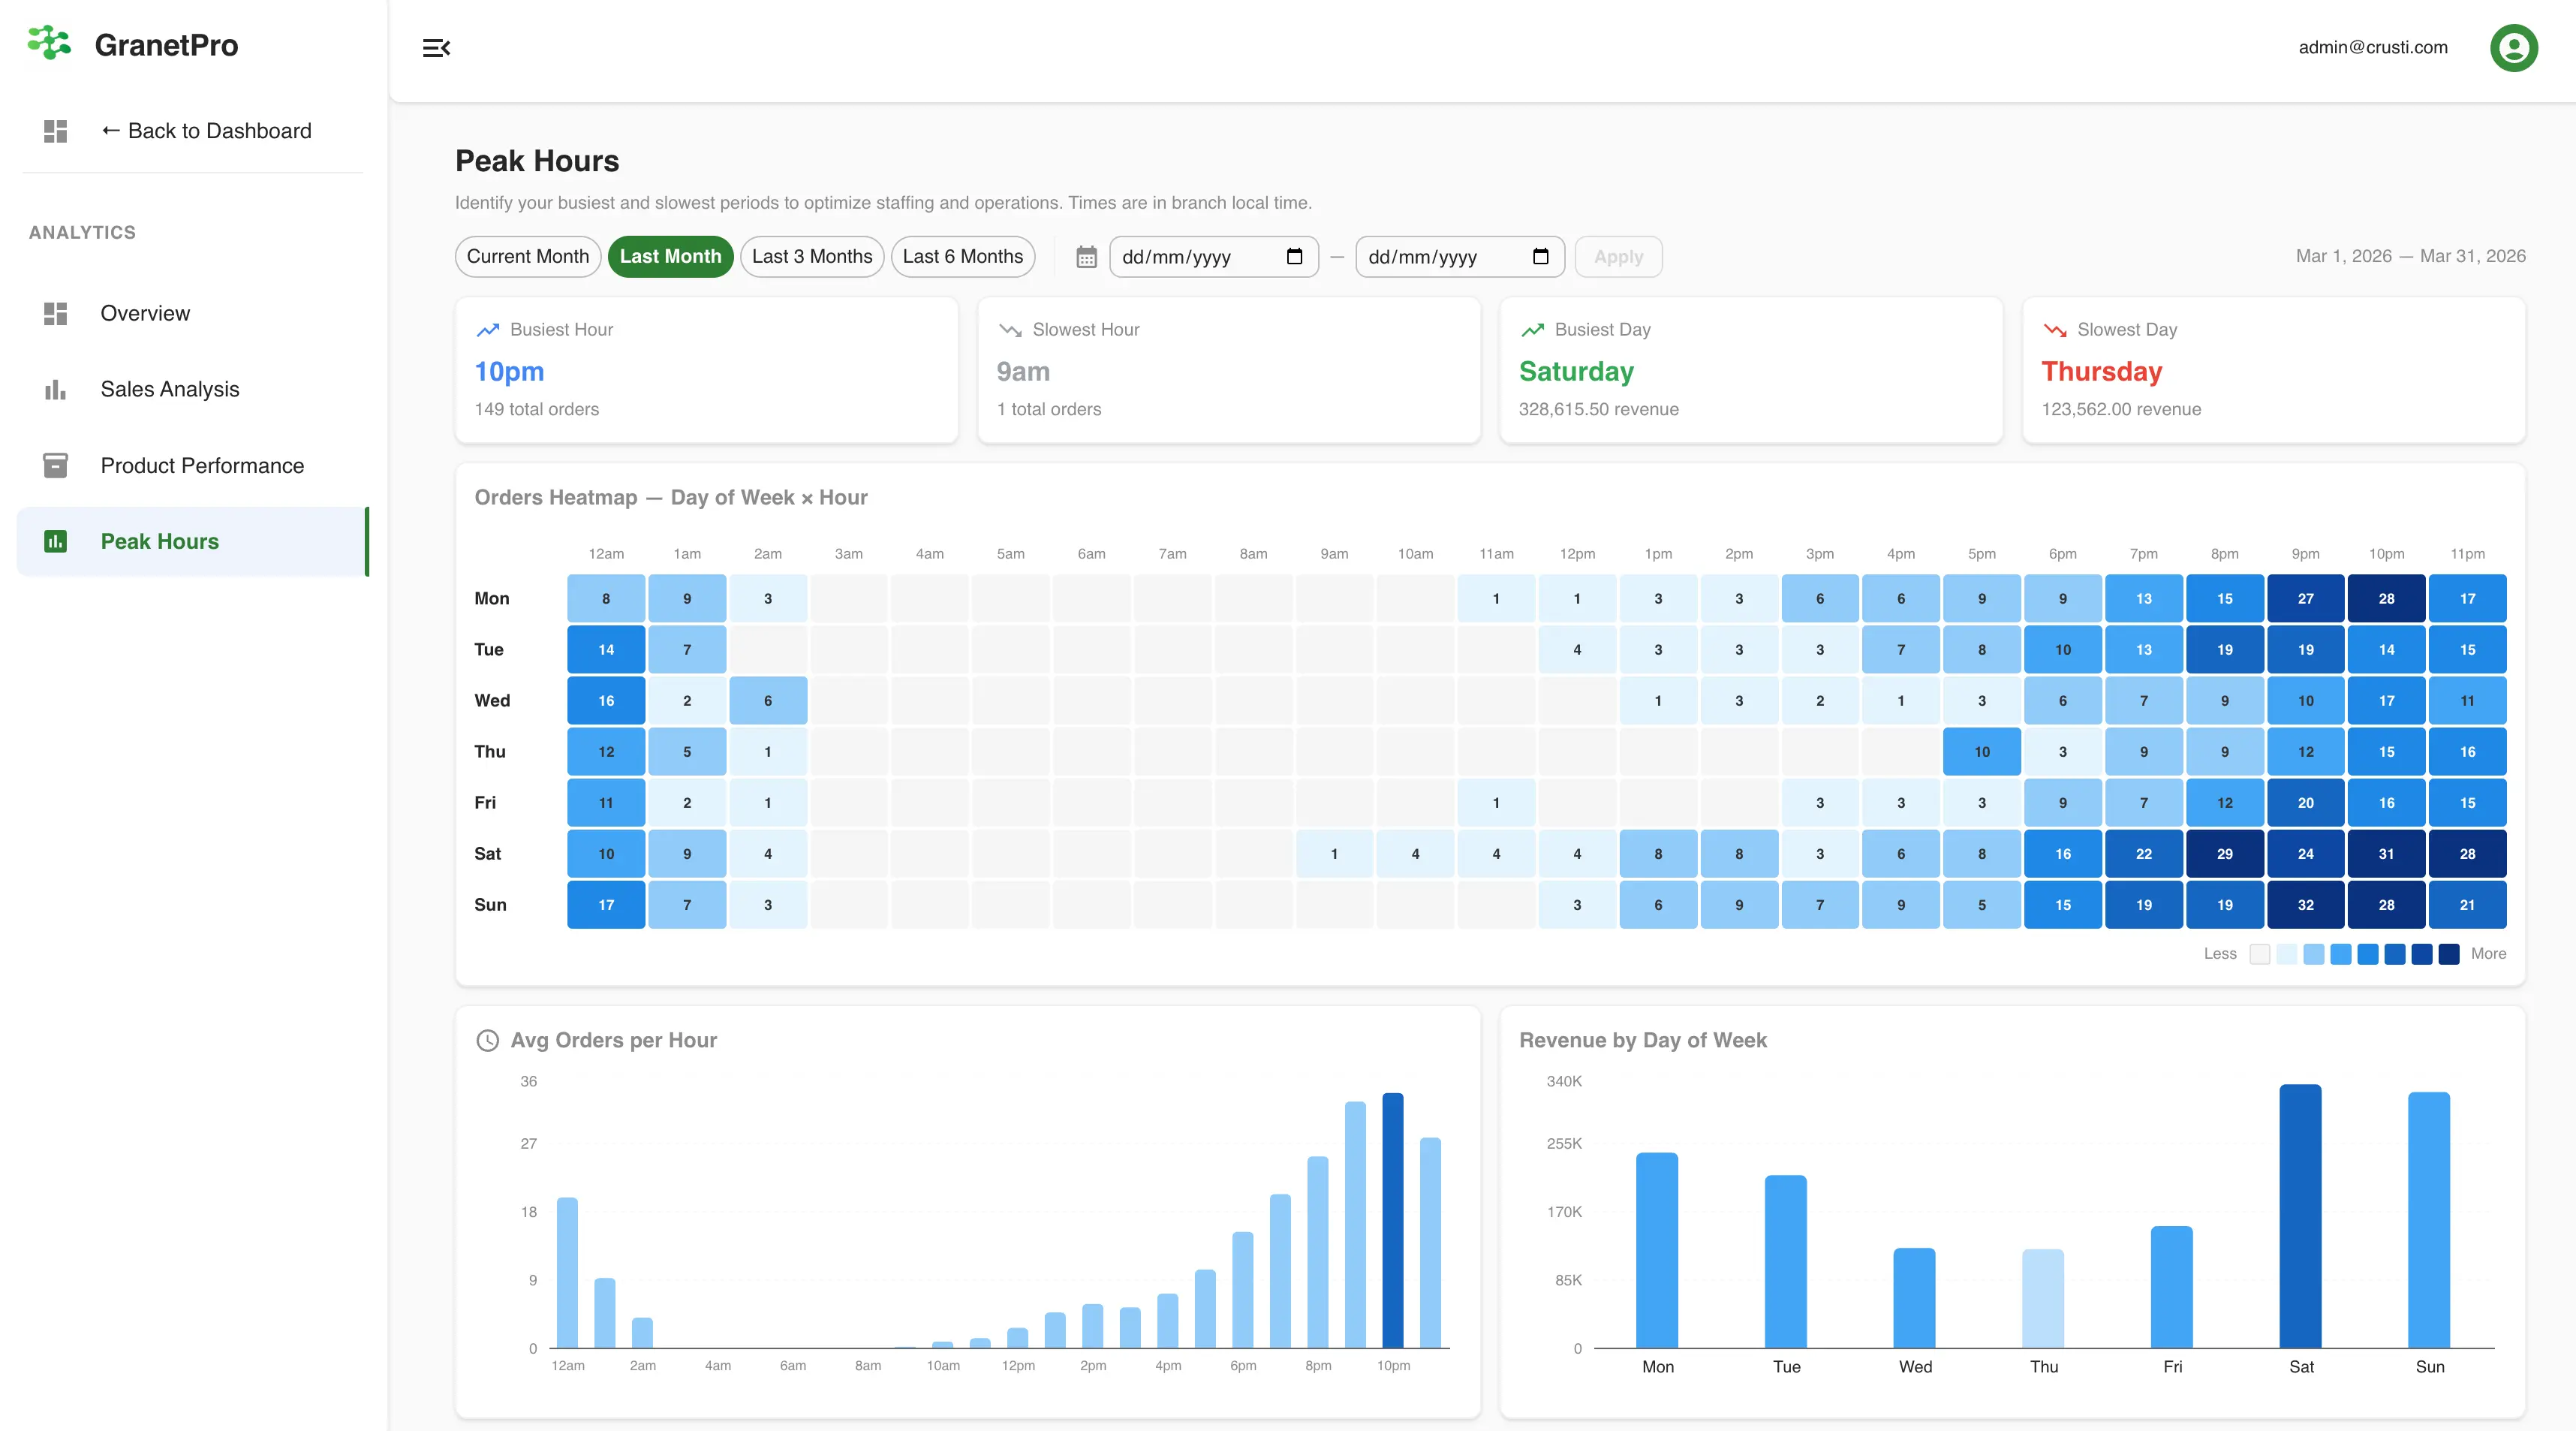
Know your top-performing product and identify your strongest and weakest trading days at a glance.
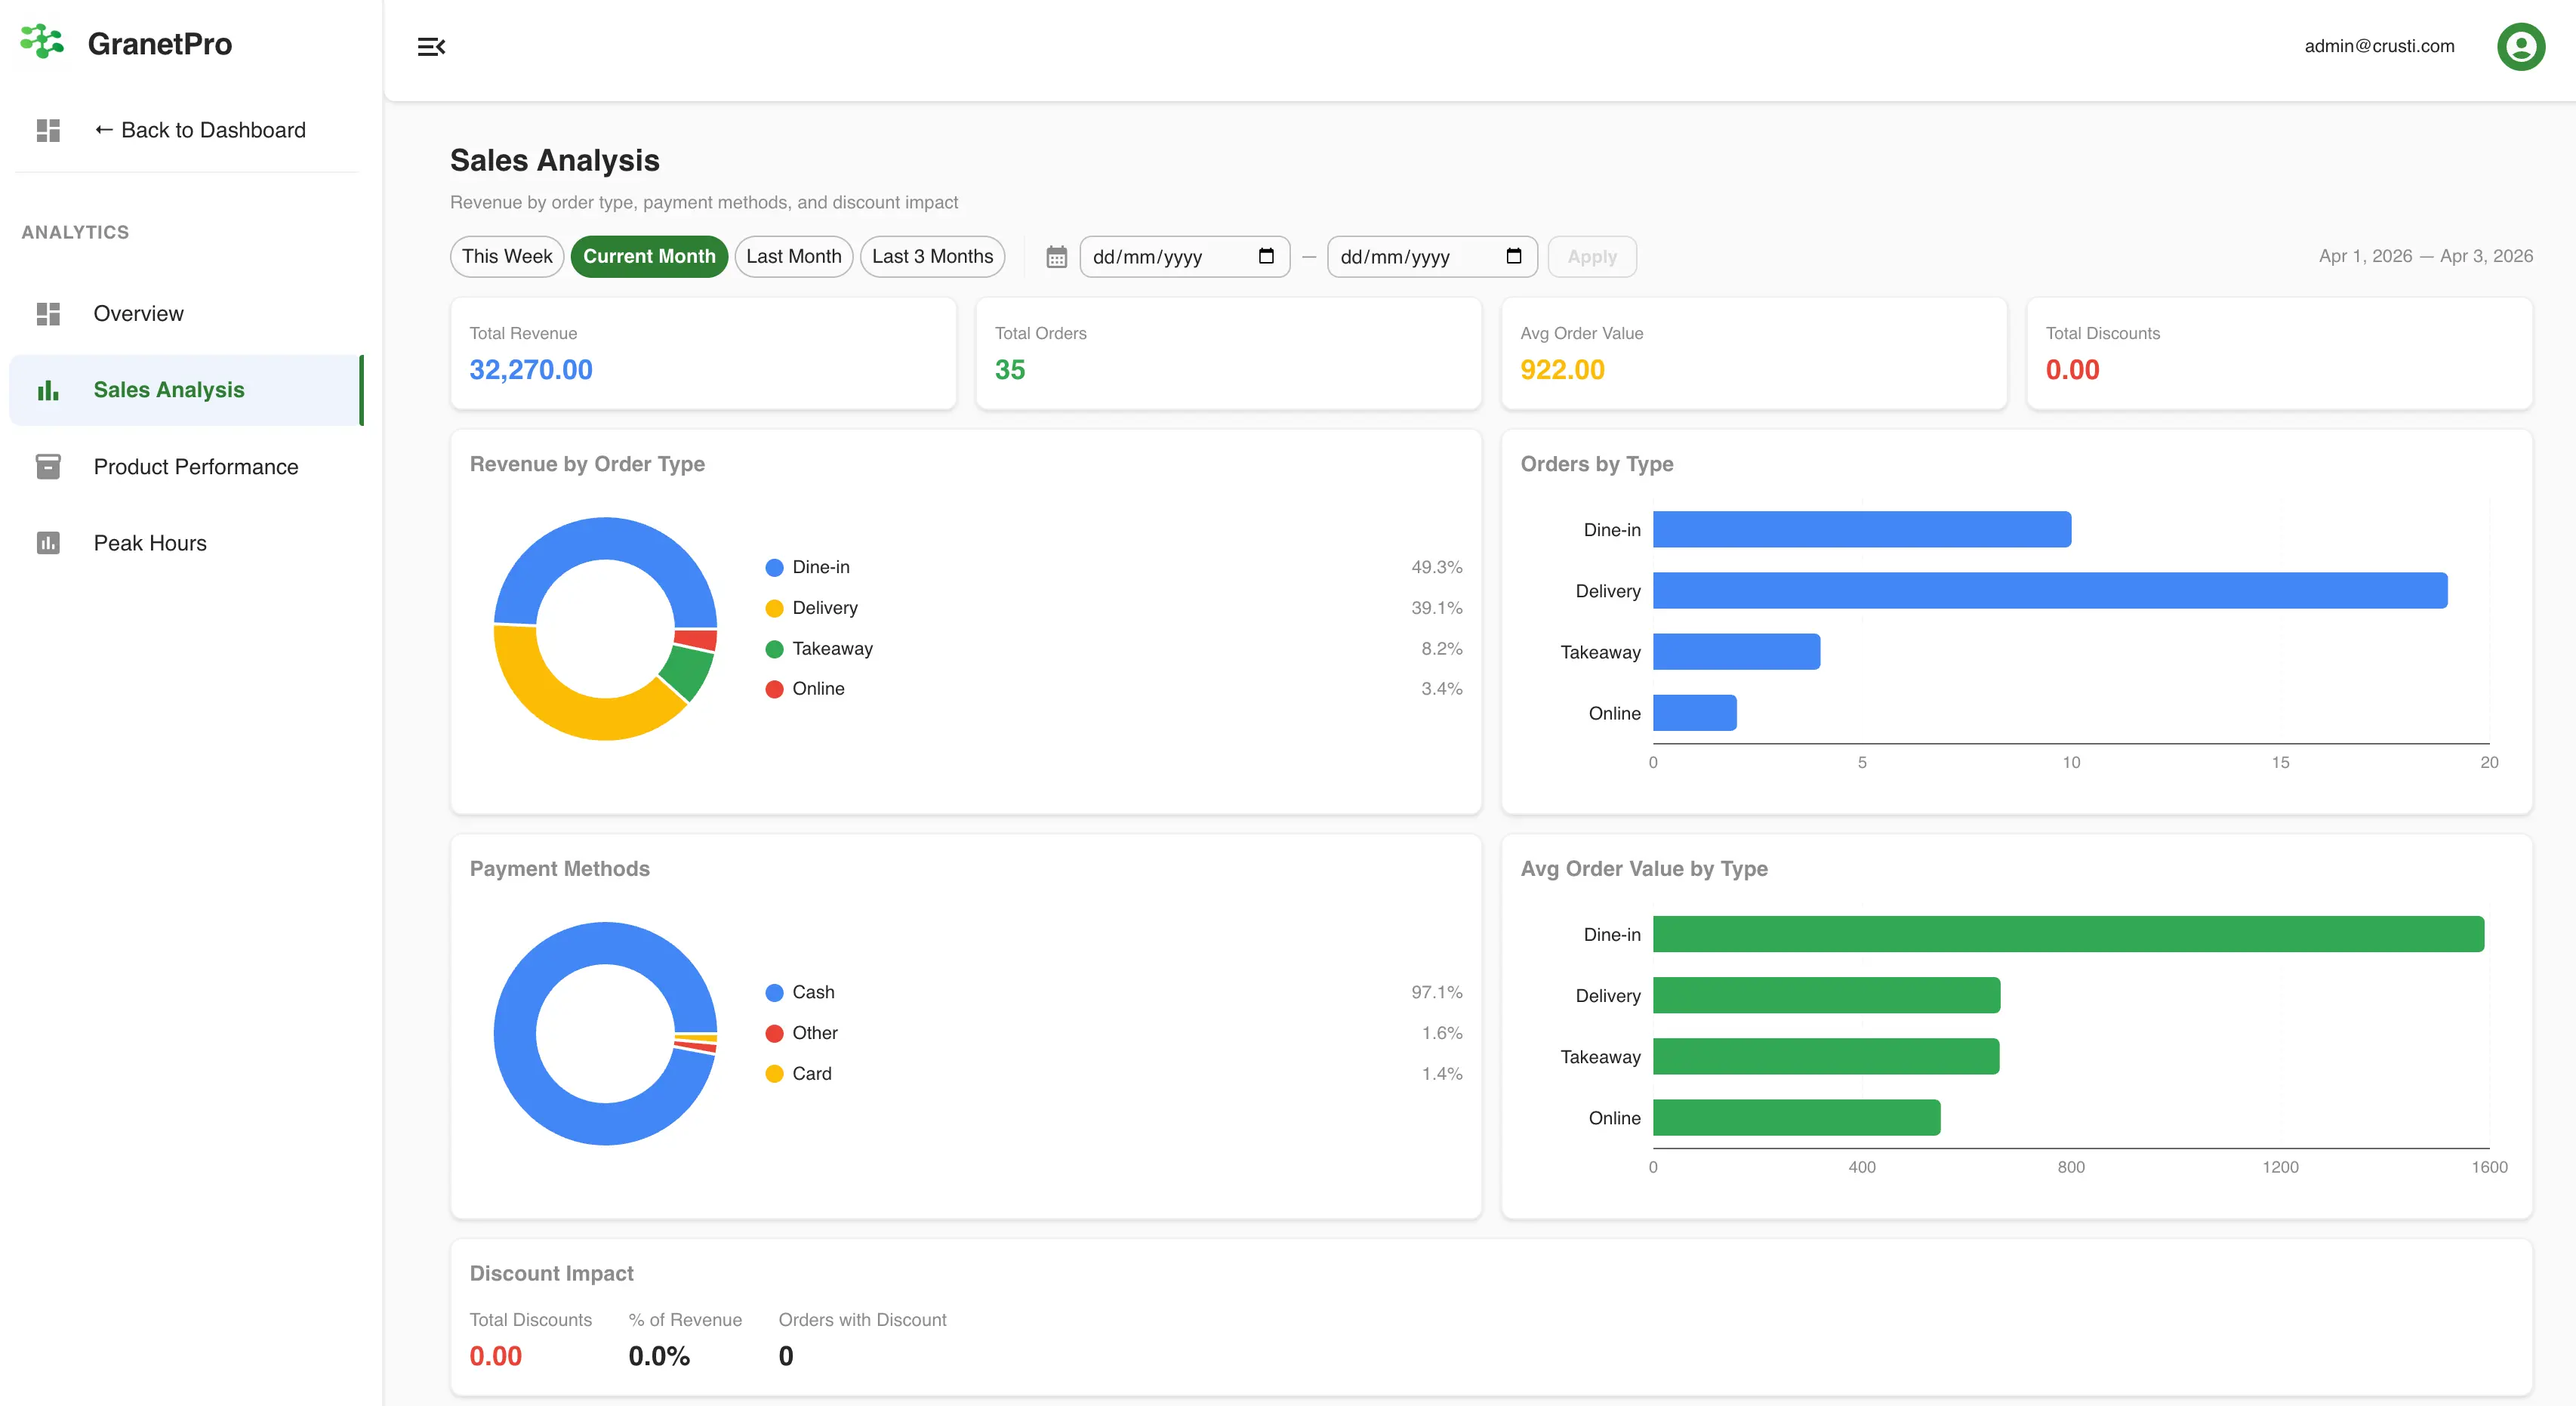
See exactly how customers pay — cash, card, online — with proportional breakdowns for reconciliation.
Revenue minus COGS minus operating expenses. Your actual profit — calculated automatically, not estimated.
Deep Dive
Overview shows the big picture; Sales Analysis, Product Performance, and Peak Hours each zoom in on a different dimension. Together, they leave no blind spots.
Break down revenue by order type (dine-in, takeaway, delivery), payment method mix, discount impact, and revenue trends over time. Understand where your money comes from and where it leaks.
Top 10 sellers, category-level breakdowns, a sortable product table with revenue and quantity, and low performers you might want to rethink or remove from your menu.
A 7-day × 24-hour heatmap showing your busiest and slowest hours. Identify exactly when to staff up, when to run promotions, and when to cut costs — without guessing.
See Your Data Come Alive
Book a demo and explore the analytics dashboards with your own data.
Downloadable Reports
Generated server-side, stored securely, download anytime. Share with your partner, accountant, or investor.
Connected System
Granet Pro analytics aren't standalone. They pull live data from the modules you already use — no manual entry, no CSV imports.
Every transaction feeds analytics in real-time — no manual entry. Each order, payment, and discount flows directly into your dashboards the moment it happens.
Learn about POSCOGS calculated automatically from stock movements and recipes. Purchase prices, ingredient usage, and wastage all flow into your margin calculations without lifting a finger.
Learn about InventorySee your revenue, costs, and margins in real-time. Book a free demo and we'll walk you through every dashboard.